How Tracksuit tracks brands in the US
We know we’re loud and proud about offering enterprise level brand tracking at an affordable price point, but this article is here to get down into the nitty gritty. That is, the research methodology of how we provide brand tracking in the United States to help businesses win 🇺🇸
We know this area can be jargon heavy and confusing so we’ve kept it simple, covering off:
- Our survey methodology
- Where our survey data comes from
- The survey process once you sign up to Tracksuit.
Let’s dive in!
Every day, we survey real-life humans to measure and understand your brand health 🙋
Tracksuit is always-on, which means we’re continuously collecting data. This data comes from a bunch of humans who have willingly chosen to participate in surveys.
We survey a diverse range of people across age, gender, region, ethnicity and income. This is to make up a nationally representative survey, which is just the fancy term statisticians use when they mean that they are confident that they have a broad enough range of survey respondents to generalize to the rest of the population (in this case, the whole of the USA).
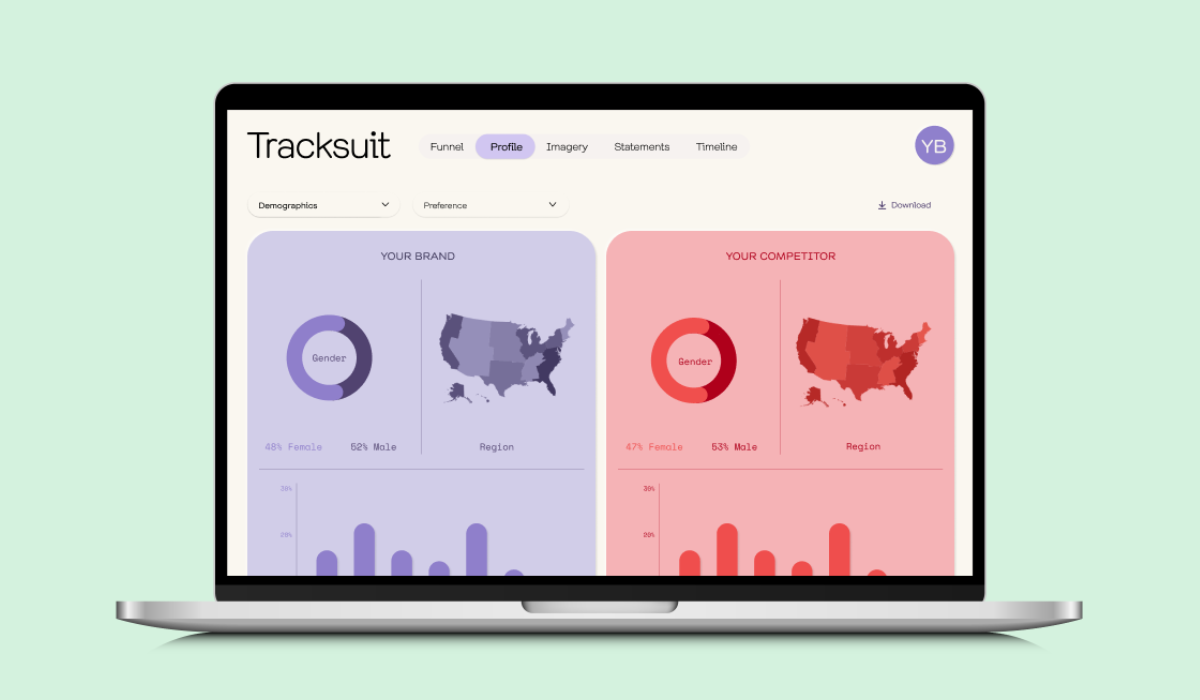
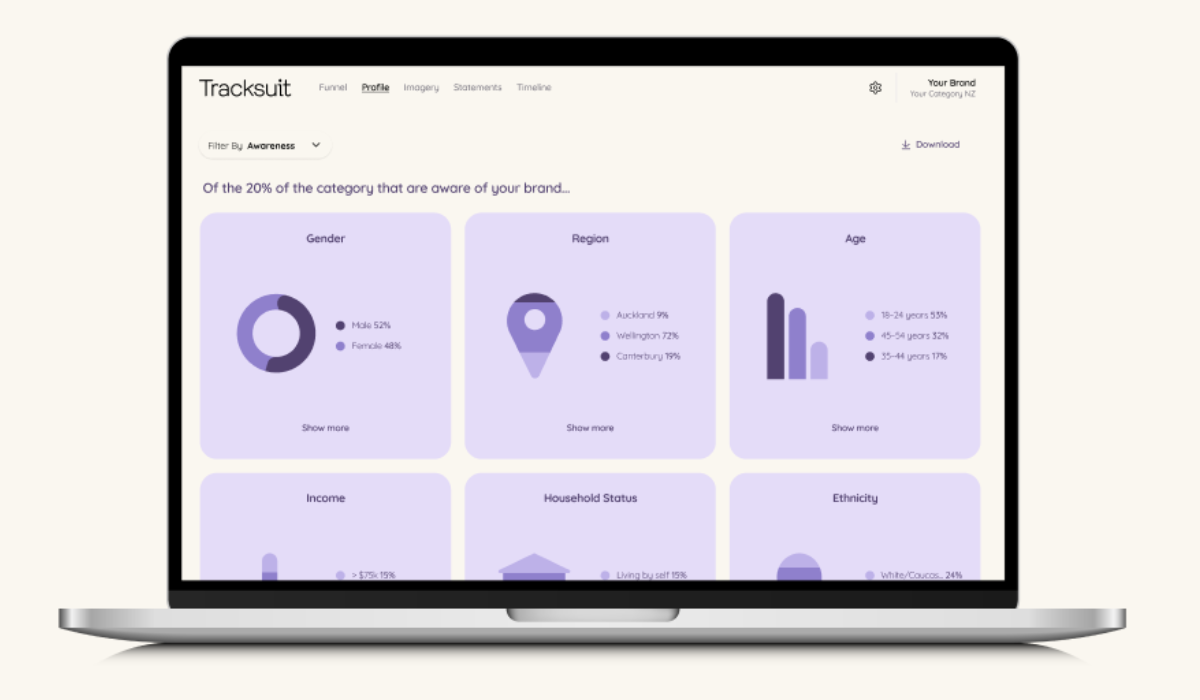
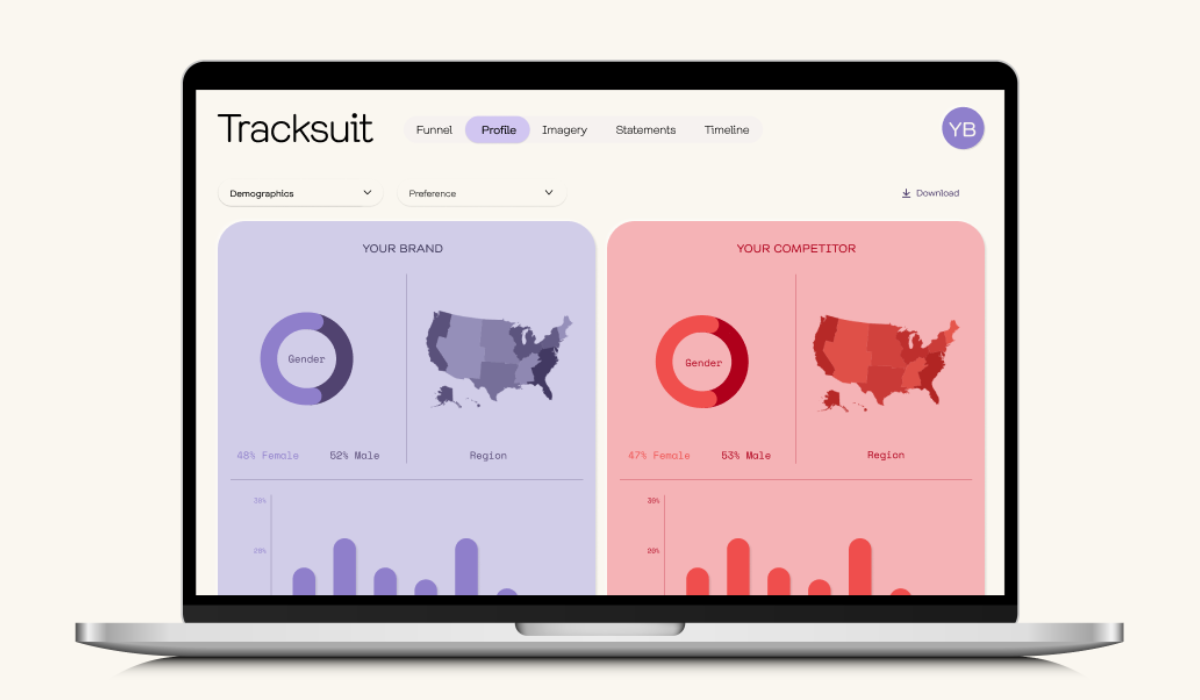
While we only survey nationally representative samples, meaning you can’t pick and choose which demographics to survey exclusively, when you hop into your Tracksuit dashboard you’ll be able to easily filter your brand metrics to the demographics you want to see data on.
This means it’s super easy for you to see how your brand metrics differ between demographics. A big upside of demographic filtering is that it can give you insight on which groups to focus your marketing on, or to confirm assumptions about who your target market actually is.
Sign up to Shorts
For fortnightly brand insights, stories and goodness that'll help you win (we promise).
Where does our first party data come from? 🔎
We work with one of the world’s best third-party panel providers called Dynata. This is the same source used by enterprise level brand trackers who have heavyweight customers such as Amazon and Spotify.
What are people's motivations to answer these surveys? 📋
Many reasons, not just for financial incentives! Some find joy and interest in doing surveys, while others love to have input in research that will improve the way products are positioned and marketed to them.
Respondents are compensated for their participation in these surveys by the panel provider. This compensation varies but is often points that are exchanged for rewards.
We like to think in a world with more brand tracking, there’ll be less crappy ads, because brands have far better visibility on what marketing’s working. We hope this motivates our survey respondents too!
Geographic breakdown on how we survey in the States 📫
We collect postcodes from each of our survey respondents. That ensures we get a nationally representative sample from each region and can aggregate the data in all sorts of interesting ways.
Right now, we’re dividing respondents into 9 regions:
- East North Central
- East South Central
- Middle Atlantic
- Mountain
- New England
- Pacific
- South Atlantic
- West North Central
- West South Central
What does all this actually look like once you sign up to Tracksuit? 📈
Month 1: Benchmarking
Once you’ve signed up, we send out thousands of surveys to a nationally representative sample and find at least 1000 people in your category. Those 1000 people set your month one benchmark.
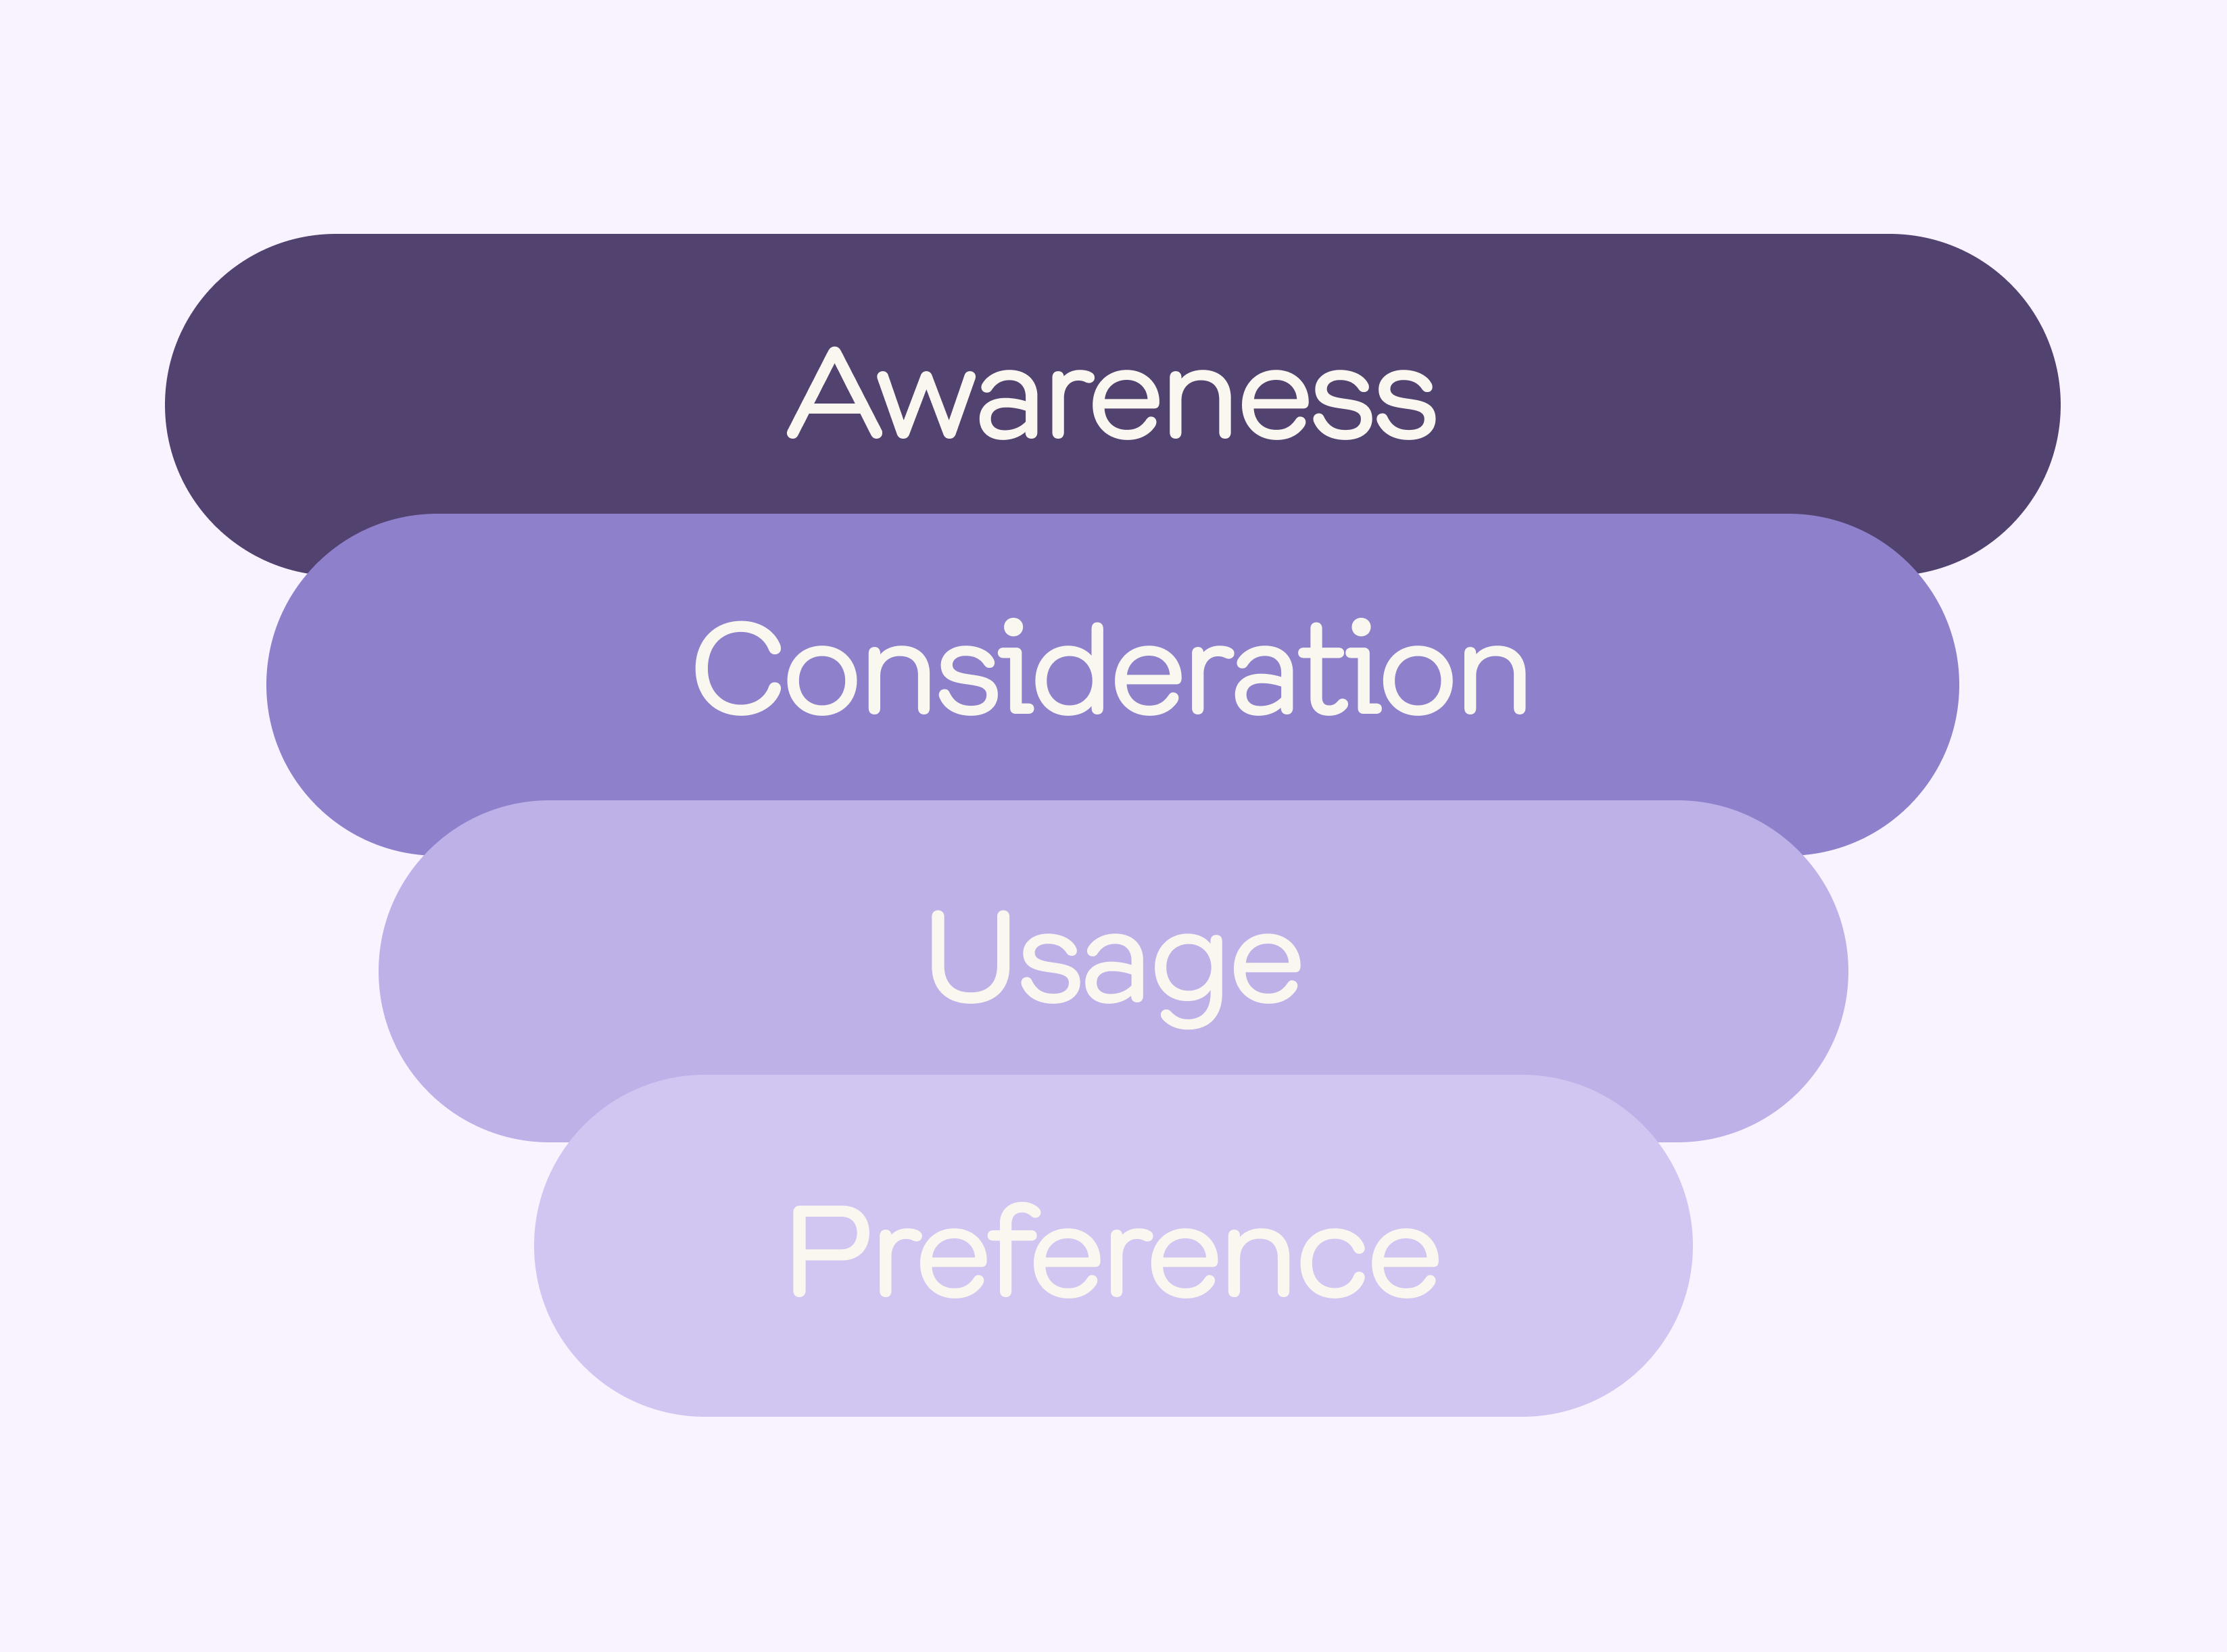
This benchmark data gives you an understanding of your current funnel metrics (like brand awareness) and means you’ll have a starting point to track from.
What do we mean by ‘category’?
This word is almost interchangeable with industry, but slightly more specific. Your category could be health supplements, exercise equipment or breakfast food, for example. Businesses who have several brands can track in multiple categories.
Why has this sample size been selected?
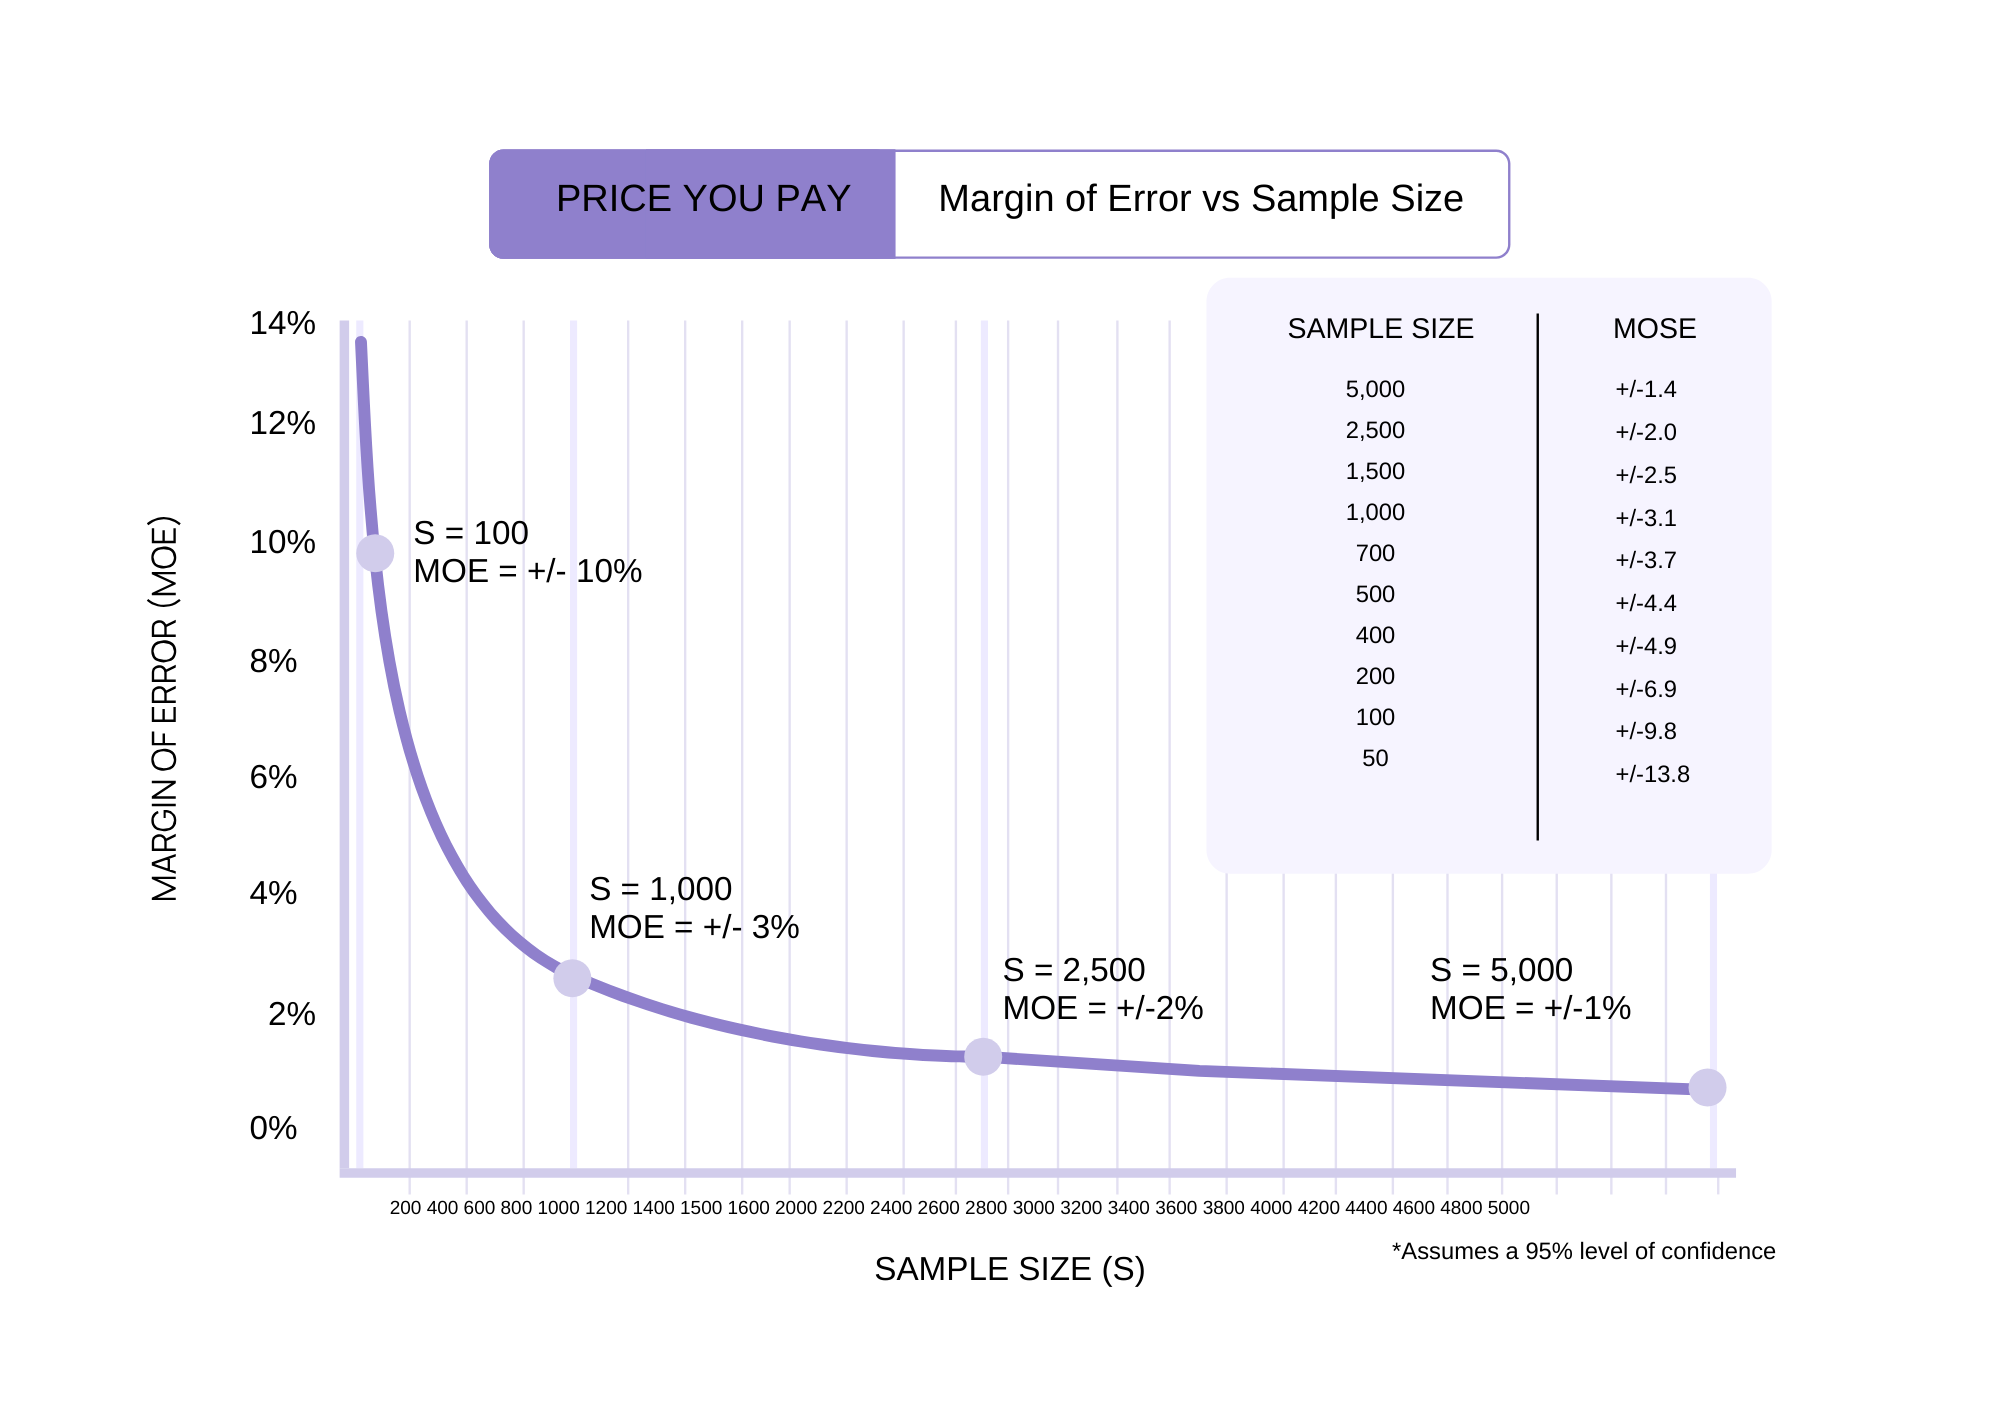
A sample size of at least 1000 gives us 95% confidence that if we surveyed every single person in the USA that we would get the exact same result + or - the margin of error.
Since surveying everyone in the United States is an unrealistic goal, statistics help give us confidence that we can generalize the results of a sample to a population!
In the case of a 1000 sample size, the margin of error is less than 3.1%. This is the global standard for enterprise brand tracking
Because of the way we survey, we sometimes gain more than 1000 respondents, but never less!
Won’t a bigger sample size give even better results?
Increasing sample sizes beyond 1000 will only marginally improve accuracy. For example, if we doubled our sample size to 2000 it only reduces the maximum margin of error by 1.1%.
Plus, if you doubled your sample size to 2000, that’s a lot more humans we’d need to survey, which has an associated cost with it and isn’t really worth the incremental gains!
Month 2 to 12: Rolling average 🗓️
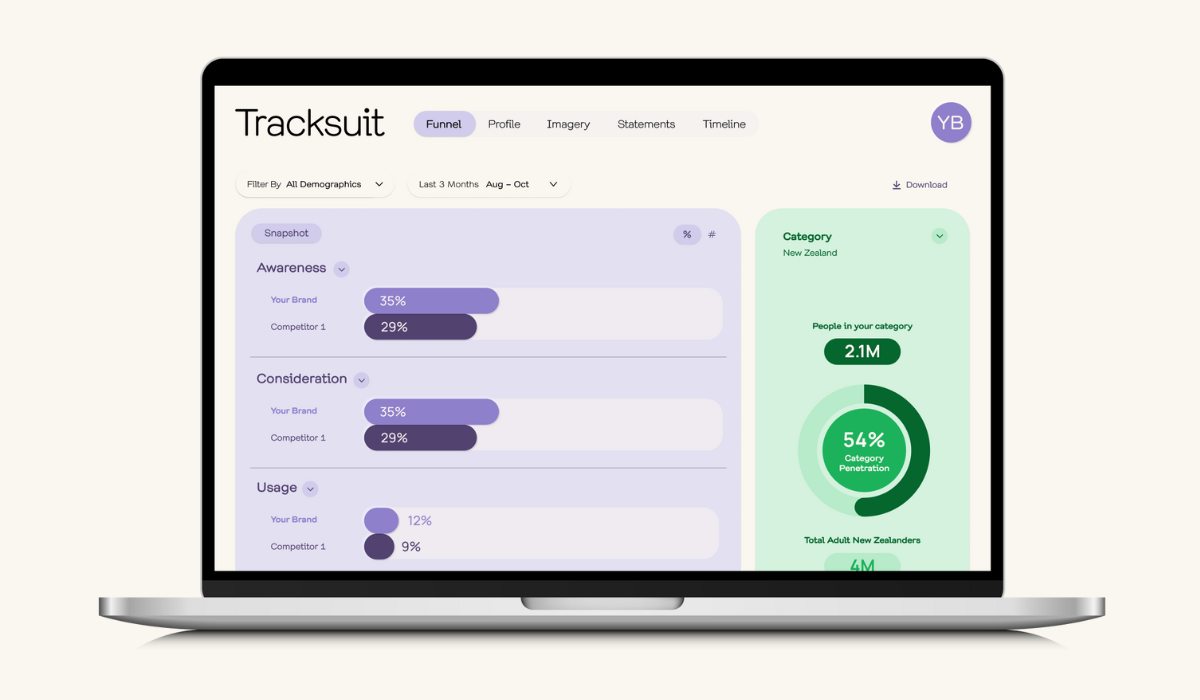
From month two onwards, you’ll have access to your beautiful Tracksuit dashboard. We survey at least 340 people in your category every month. These responses are coming in every day, as the survey is always-on.
This means you can easily see how seasonality changes your metrics and how your campaigns are impacting growth in virtually real time.
Instead of getting your brand tracking data in the form of a 100 page report that we know you’ll look at guiltily every time you see it gathering dust on your desk, you can just log into Tracksuit’s beautiful dashboard whenever it suits you.
What now? 🏃
If you want to dive into any of this in more detail, request a demo with one of our brand experts who’ll set you on the right track (pun intended).
We live for the bold, the brave, the ambitious growth brands making their mark out in the world and we hope yours will be the next we work with.
Until next time, brand champion!
