Use Response Data to Improve Brand Performance
Written by

Tracksuit is an easy-to-use solution for monitoring your brand and category. It’s powerful, but there are more insights in the data than we can surface in the Tracksuit App. That’s why we’ve built our new Response Data Export feature.
What is Response Data?
The numbers and reports surfaced in the Tracksuit App come from real humans responding to our online surveys.
The Response Data is the individual answers each respondent gave to each question in your category.
What does the data cover?
The data file covers every response we received from a respondent who qualified as ‘active’ in your category. Check your Survey Details page for your category’s ‘Qualifying Question’ to find out who this is.
Sign up to Shorts
For fortnightly brand insights, stories and goodness that'll help you win (we promise).
What’s so great about Response Data?
The Response Data includes the results for some survey questions that you can’t currently access in the Tracksuit App. Variables such as income and ethnicity are included in the data so you can profile your brand and category in new ways.
The Response Data is flexible, meaning you run custom analysis and surface a host of insights that aren’t currently available in the Tracksuit App. You can find answers to questions such as:
- What is the profile of a category buyer and how is that changing over time?
- What % of people are aware of my brand but not my competitors?
- Which competitor brands do I share the most users with?
Getting a bigger brand marketing budget is a challenge faced by most marketers. Here's how to make the case for more brand investment
How does it work?
There are many tools you can use to work with Response Data, such as:
- Excel
- Google Sheets
- Tableau
- SPSS (or PSPP)
- Q.
For this specific example, we’re going to use Excel and tackle the question ‘What's the gender breakdown of people active in my category?’
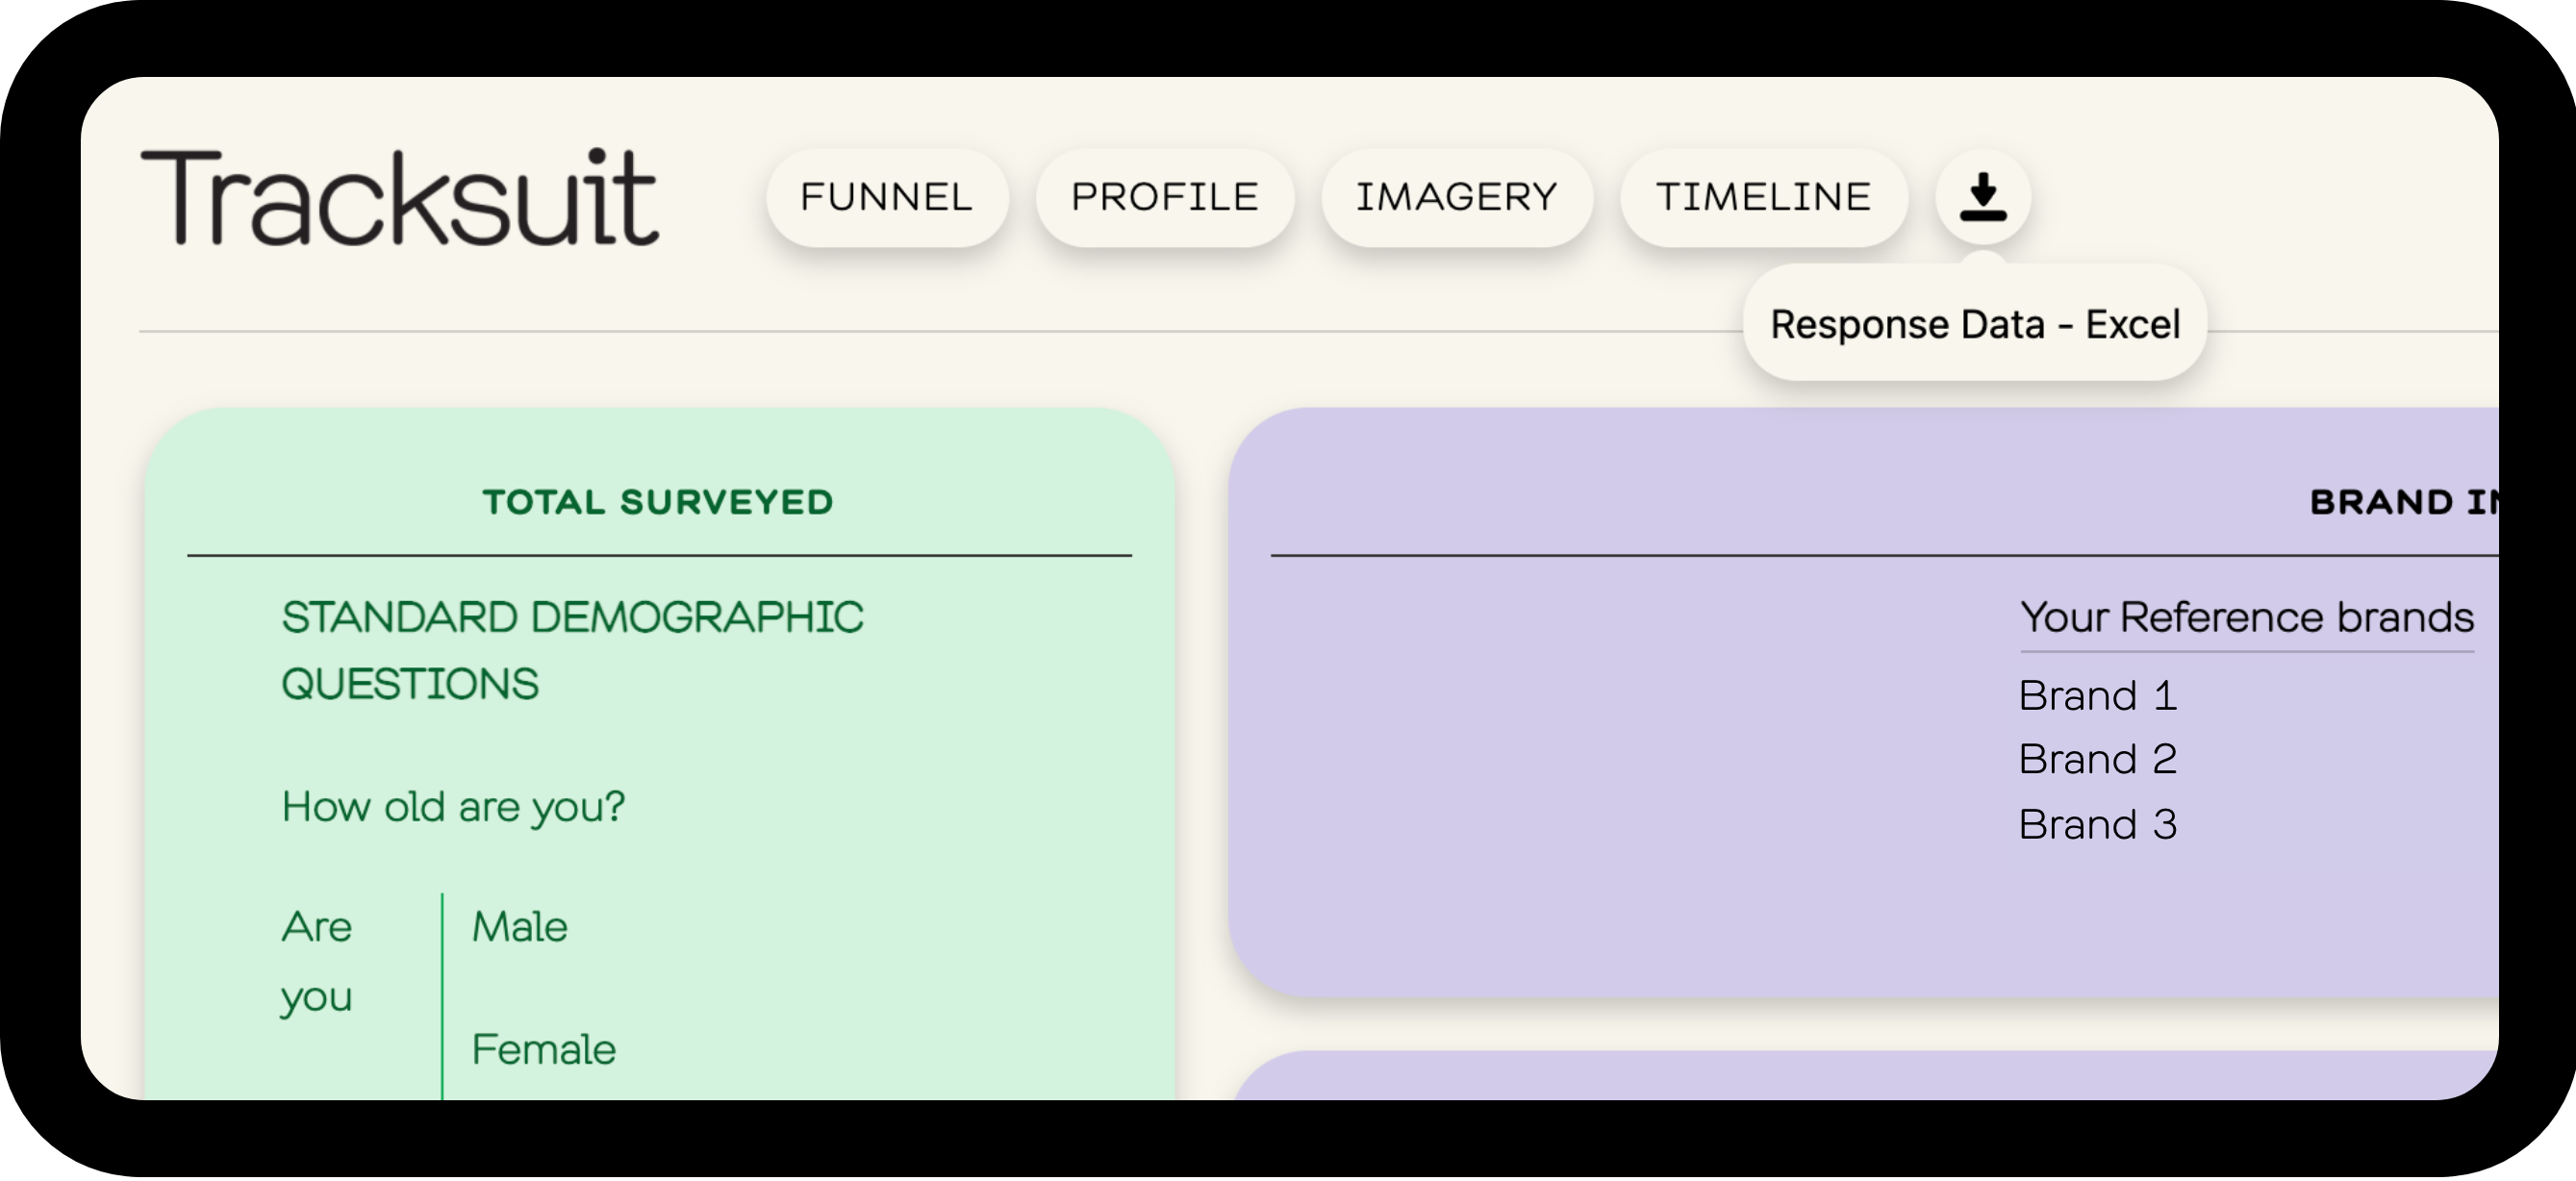
1. Export the data
Export the Response Data file using the download button on the Survey Details page in the Tracksuit App.
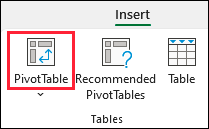
2. Create your pivot table
Once you’ve downloaded the file, open it in Excel and make a pivot table, opens in new tab
To make a pivot table, Select Insert > PivotTable and flow the instructions in the dialog boxes.
3. Select the fields
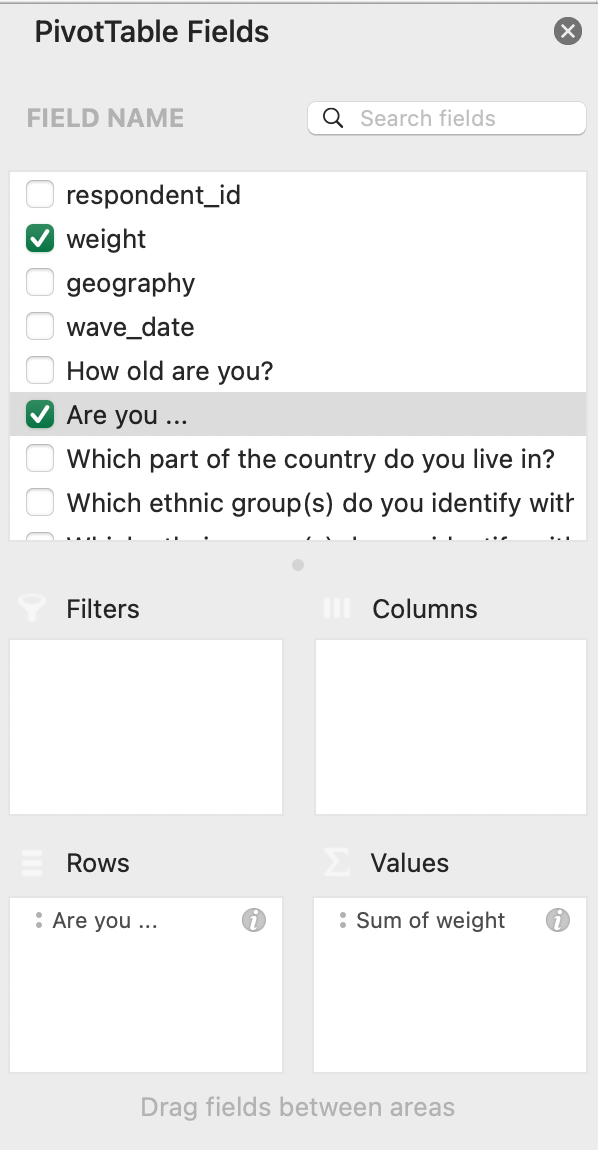
In the Pivot Table Fields menu on the right, we can build our pivot table. Start by dragging ‘Are you…’ to the Rows box and ‘weight’ to the Values box.
Note that like most well-designed surveys, all results in Tracksuit need to be weighted to ensure the sample results best represent the true population. So, we sum the weight variable rather than count the number of respondents.
4. Format the results
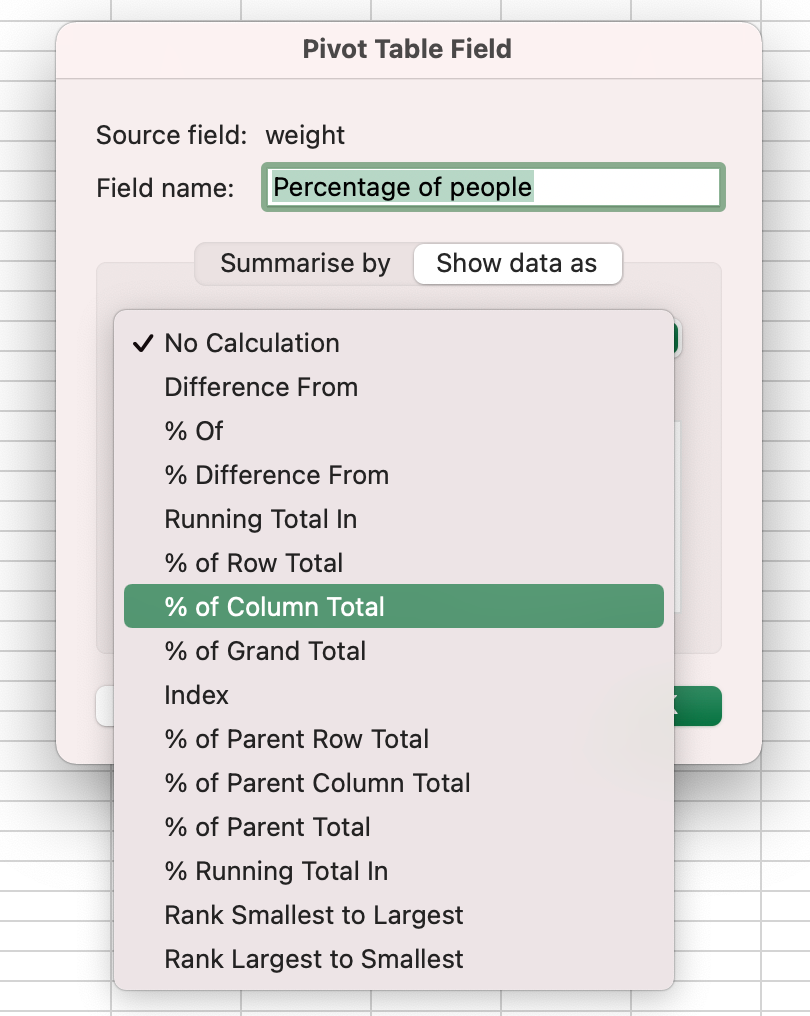
At this point the values in the pivot table are the sum of the weight variable which can be a little hard to interpret. Next we select the i button next to ‘Sum of weight’ and in the popup box select ‘Show data as’. From here we can rename it to something more useful like ‘Percentage of people’ and select ‘% of Column Total’ in the drop down menu.
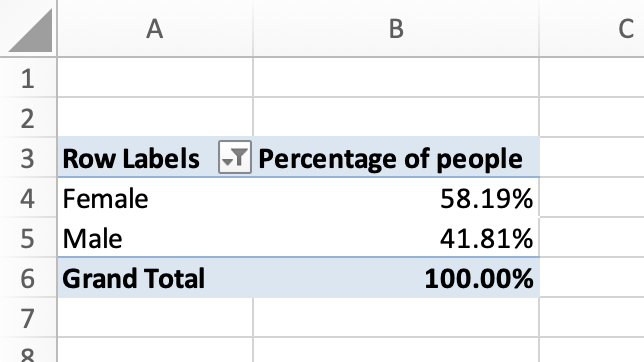
5. Done!
Now our pivot table should be showing the gender breakdown of all the people active in your category.